TUTORIAL: graphic charts for INTARSIA
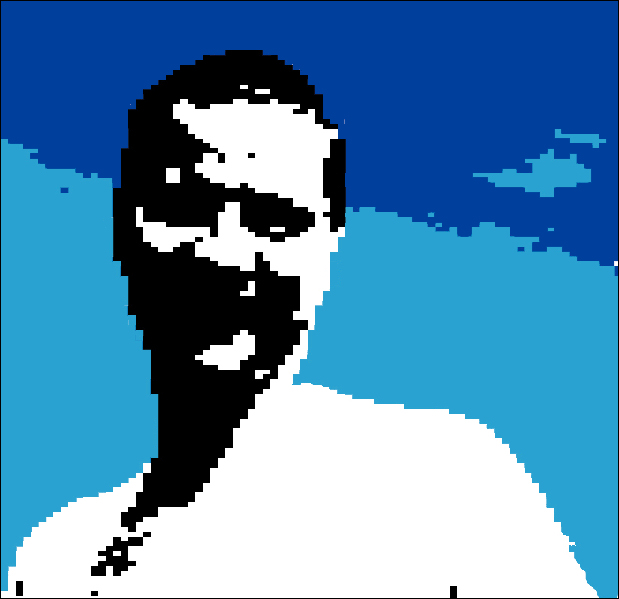 I'm into making cushins for the couch. I've worked out these images in photoshop and made a graphic knitting chart. It's supposed to be worked in intarsia. The idea is to have the couch crowded with people in the end...
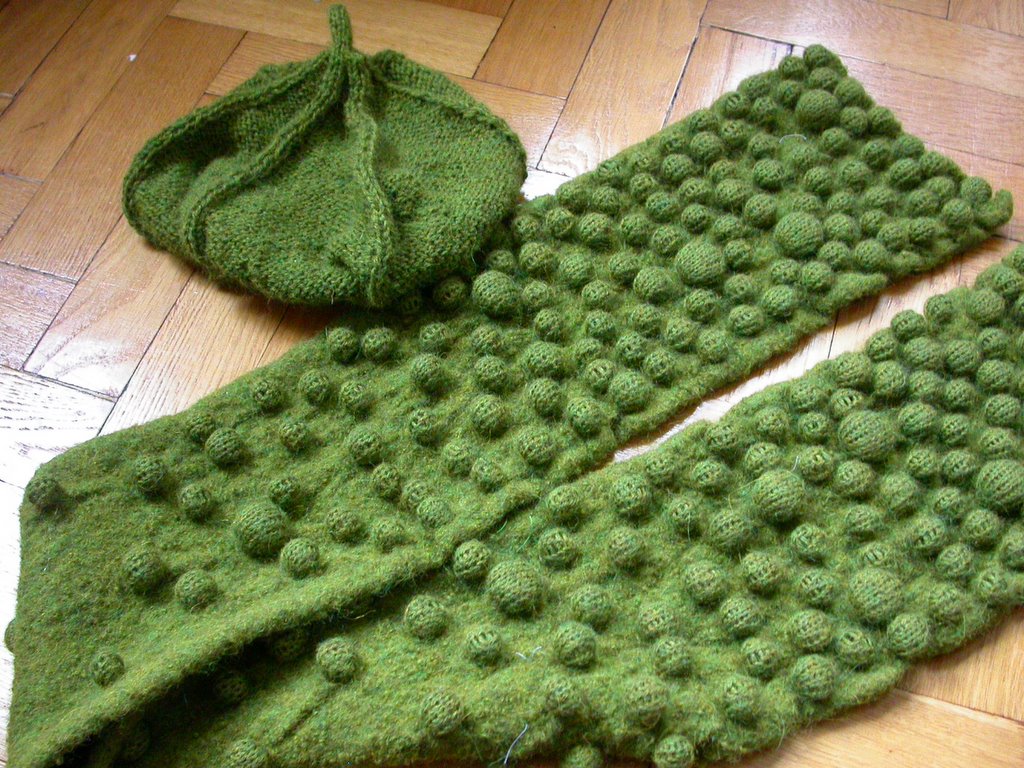
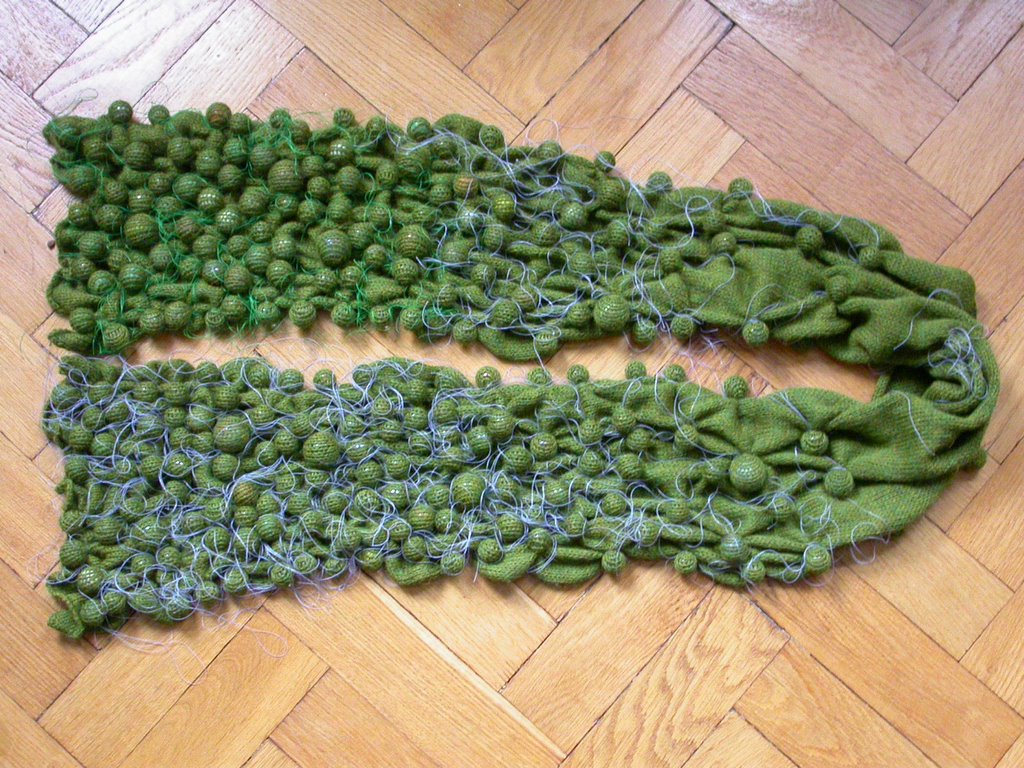
 Guess who it is? I called the first "Beachboy" and the second one "The Woman in Red". Or I might make me a felted bag/tote out of it! Want to see which pics I worked it out from? Here and here it is!
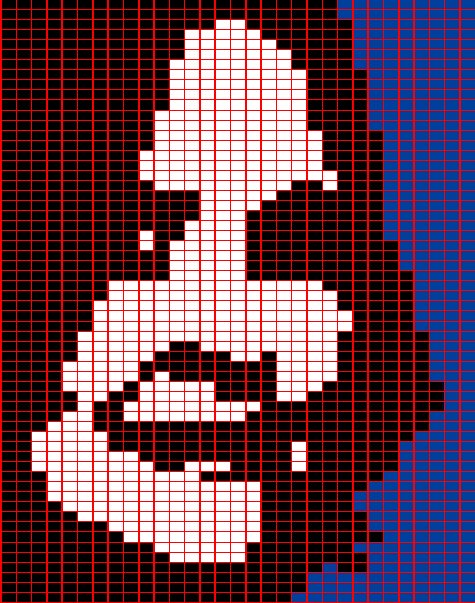 Learn how to chart
Knitpro (translates digital images into knit)
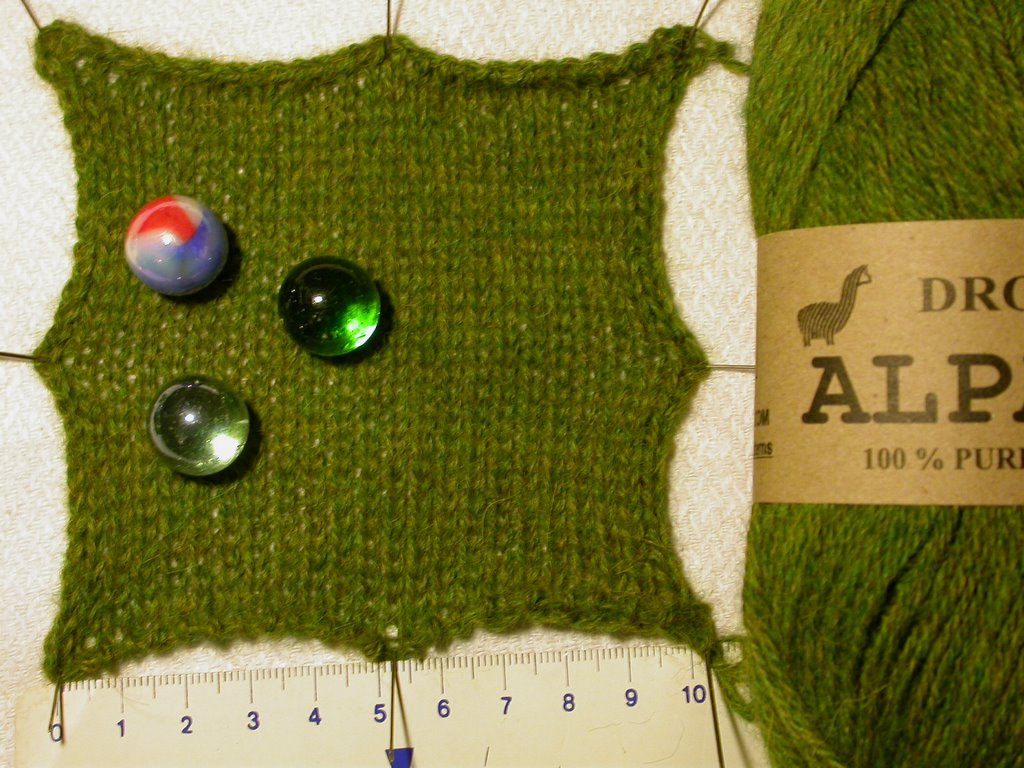
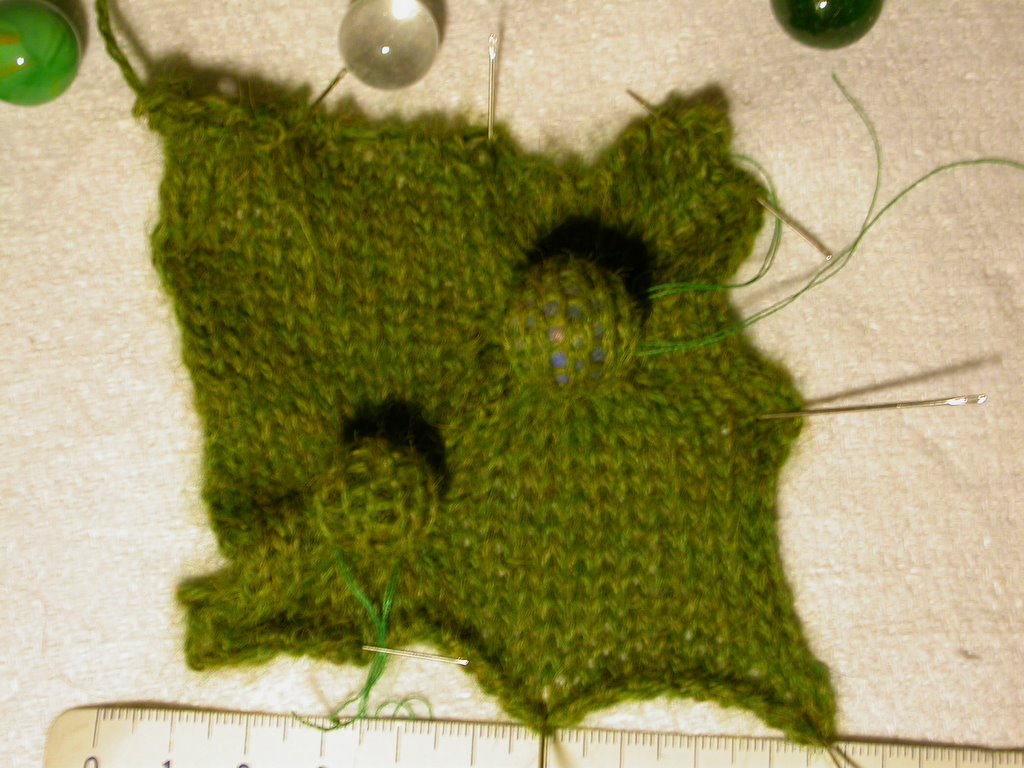
Intarsia
The Knitpro provides a chart with square stitches. In that way you will end up with a squeezed image in the end, since the gauge is never 1 to 1. What you need to do (following the description on Knitty) in Photoshop is:
1) (image/Pixel Aspect Ratio/Custom) Change the Factor. Measure on your test swatch what gauge you have on 10x10cm. For example: 21 stitches on 32 rows has a Factor 32/21=1,523
You will now have a squeezed image.
2) correct the image (image/image size). Uncheck"Constrain proportion". In "Pixel Dimention" select "percent". Leave the Width at 100% and change the Height to 152,3%. The image will now be square again.
3) follow the description on Knitty.
If you make a closeup you'll see that the pixels aren't square anymore but rectangular. In this way you will have a "What You See Is What You Get Chart". If you want to save it as a jpg you will need to put the pixels back to square and change the width to 152,3% (otherwise photoshop will automatically save it with square pixels end you will have a long-faced image.
posted by alexandra at 1:38 PM
7 comments
![]()

